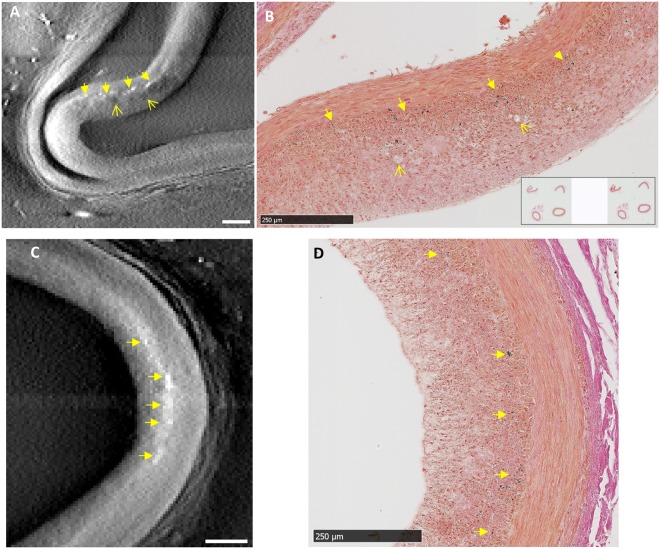
Figure 2.
Correlated findings of loose clusters of micro calcifications in the intima in location-matched pairs of tomographic and histological images. In x-ray tomographic images calcifications appear as brighter dots and patches due to their higher mass density; adipose tissue such as foam cells appear as dark patches due to their lower density. The histological slides were stained with von Kossa stain for calcifications which appear as dark brown or black color. (A) and (B) Scattered clusters of micro calcifications (solid arrows) of an atherosclerotic lesion are seen in matching locations of the paired images, together with foam cells in the neo intima (open arrows). (C) and (D) A second lesion shows scattered intimal micro calcifications (solid arrows) in matching locations between the x-ray and histological images. Scalebars are 250 µm.

