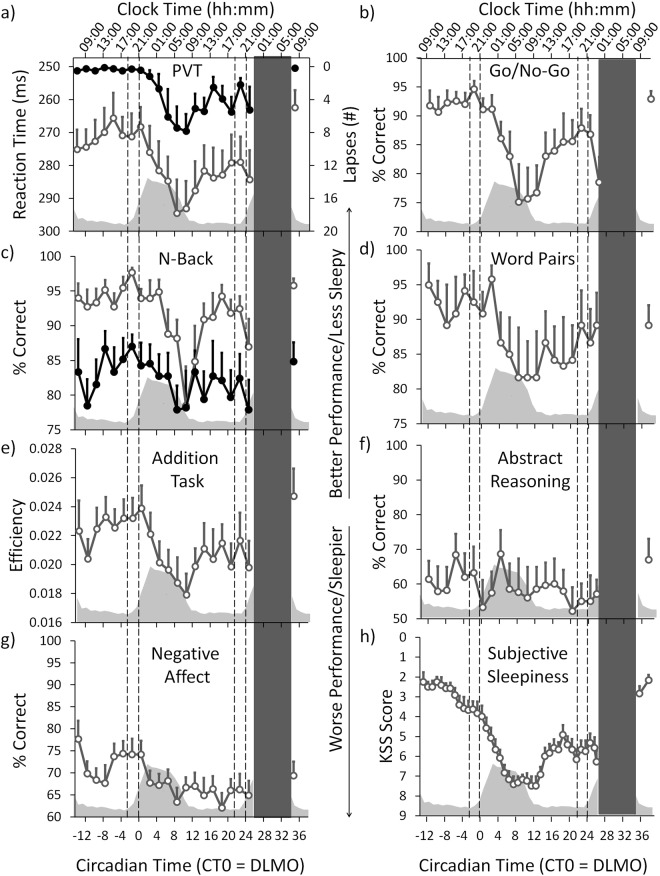
Figure 2.
Cognitive performance and subjective sleepiness. The upper x-axis shows the mean clock time. The lower x-axis shows the circadian time in hours relative to the DLMO of the first evening (= CT 0). Note: the y-axis for PVT performance and the KSS have been inverted so that the direction is similar to the other cognitive tests (i.e. higher indicates better performance and less sleepy). The grey inlay shows the melatonin secretion profile across the CR and during the first 4 h after the recovery night. The two sets of dotted lines indicate the time ranges of both WMZs. The black bar represents the scheduled sleep episode (=recovery night). Mean ± SEM (n = 12). See also Table S1.1. (a) PVT; open grey circles = median reaction times; filled circles = lapses. (b) Go/No-Go Test. (c) N-back Test; open grey circles = 2-Back version; filled circles = 3-Back version (ns). (d) Word-Pair Memory Test (ns). (e) Addition Task. (f) Abstract Reasoning (ns). (g) Negative Affect Test. (h) Subjective Sleepiness (KSS).

