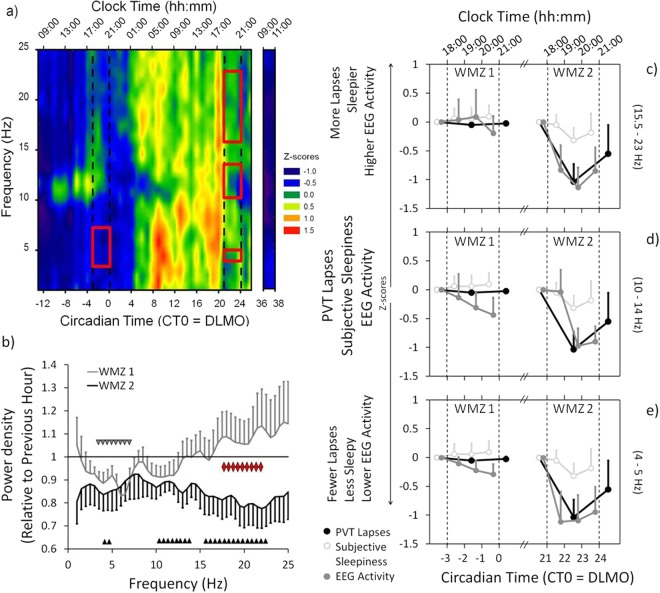
Figure 3.
Wake-EEG, PVT lapses and subjective sleepiness during the WMZs. (a) Heat plot of the wake-EEG power density (standardized data; 0.5 to 25 Hz) over the 40 h CR and during the 2 h after the recovery night (frontal derivation; F4). Blue colors = lower EEG power density. Red colors = higher EEG power density. The upper x-axis shows the mean clock time (hh:mm). The lower x-axis shows the circadian time in hours relative to the DLMO of the first evening (=CT 0). The two sets of dotted lines indicate the time ranges of the two WMZs. The red rectangles show the frequency bins with significantly lower EEG power density during the WMZ compared to the preceding hour (WMZ 1: delta/theta range 3.0–7.0 Hz; WMZ 2: delta/theta 4.0–5.0 Hz, alpha 10.0–14.0 Hz and sigma/beta 15.5–23.0 Hz). (b) Changes in EEG power density during WMZ 1 (grey line) and WMZ 2 (black line) relative to the preceding hour. Frequency bins with significantly lower power density during WMZ 1 are indicated by grey downward triangles and during WMZ 2 by black upward triangles. Red triangles show the frequency bins (high sigma/beta range 17.5–22.5 Hz) with statistically significant differences between both WMZs (while expressed relative to the preceding hour). (c, d & e) All three panels show subjective sleepiness (open circles) and PVT lapses (closed black circles) during both WMZs relative to the preceding hour. Results for WMZ 1 are shown on the left and for WMZ 2 on the right side. Each panel compares the change in subjective sleepiness and PVT performance with one of the EEG frequency ranges (closed grey circles) which showed a reduction in EEG power density during WMZ 2 (from top to bottom: sigma/beta, alpha and delta/theta ranges). The upper x-axis shows the mean clock time. The lower x-axis shows the circadian time in hours relative to DLMO. The two sets of dotted lines indicate the time ranges of the WMZs. All data was standardized (z-scores). Mean ± SEM.

