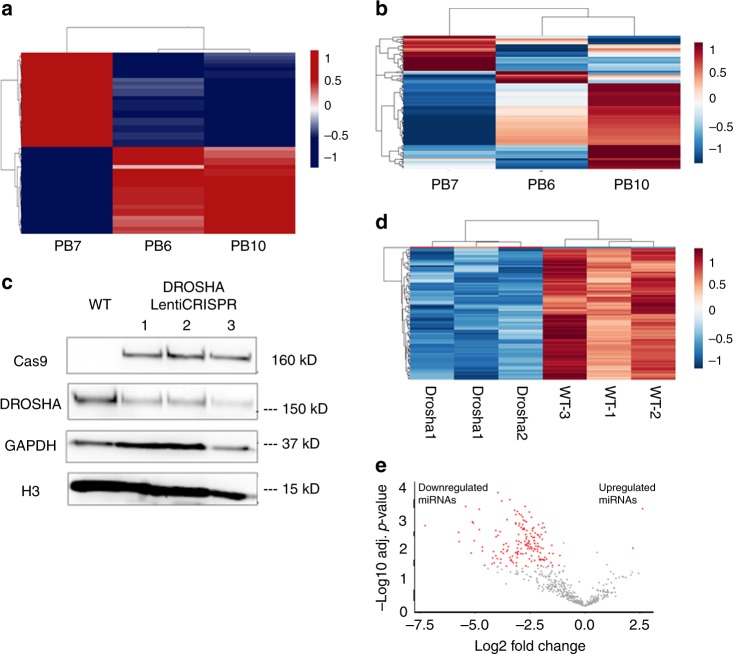
Fig. 5.
Effect of DROSHA alteration in pineoblastoma: Three human samples were available for RNA analysis. PB7 with concurrent homozygous DROSHA deletion and PDE4DIP gain, and PB6 and PB10 with PDE4DIP gain only. a Whole-transcriptome analysis shows that PB7 has distinctly different transcriptomic profile compared to PB6 and PB10 (unsupervised clustering, top 50 differentially up and down regulated genes shown), for detailed list see Supplementary Table 2. b PB7 with DROSHA deletion also shows markedly altered miRNA profile, (unsupervised clustering, top 200 differentially expressed miRNA shown, for detailed list see Supplementary Table 3). c Disruption of the DROSHA locus using CRISPR in human neural stem cells (hNSC) shows reduced levels of DROSHA protein, for quantification see Supplementary Fig. 6. d, e hNSC with mutation of DROSHA show markedly reduced levels of miRNA mirroring the clinical samples. d Unsupervised hierarchical clustering analysis based on expression data for the Top 85 differentially expressed miRNA show striking difference between DROSHA-mutated (Drosha1–3) and wild-type (WT1–3) hNSC samples. e Volcano plot shows marked reduction of miRNA in DROSHA-mutated hNSC. The x axis represents the difference of group means of DROSHA mutated and wild-type hNSC; the y axis represents the statistical significance. Each miRNa is represented by a dot, and red dots represent miRNAs that were significantly differentially expressed between groups. For detailed list of miRNAs see also Supplementary Table 4

