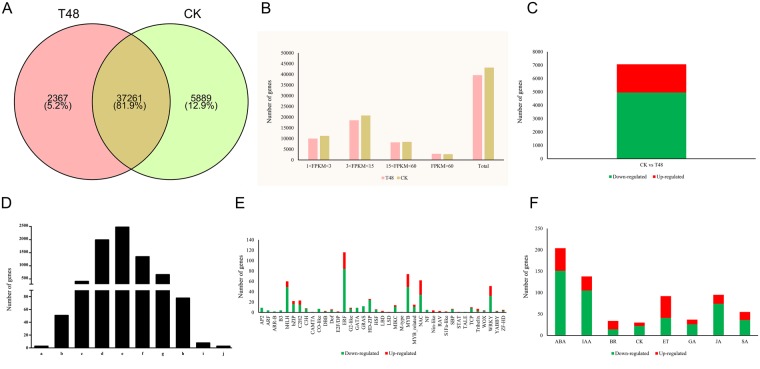
Figure 1.
Gene expression profiles in two samples and DEGs identified at 48 hpi after S. sclerotiorum infection. (A) Venn Diagram of genes detected in the two samples. (B) Statistical analysis of gene expressions identified in two samples; (C) Statistical analysis of DEGs identified at 48 hpi after S. sclerotiorum infection; (D) Fold changes in the DEGs identified at 48 hpi after S. sclerotiorum infection. [(a) Number of DEGs with a log2 fold change ≤−9; (b) number of DEGs with −9 < log2 fold change ≤−7; (c) number of DEGs with −7 < log2 fold change ≤−5; (d) number of DEGs with −5 < log2 fold change ≤−3; (e) number of DEGs with −3 < log2 fold change ≤−1; (f) number of DEGs with 1 < log2 fold change ≤3; (g) number of DEGs with 3 <log2 fold change ≤5; (h) number of DEGs with 5 < log2 fold change ≤7; (i) number of DEGs with 7 < log2 fold change ≤9; (j) number of DEGs with log2 fold change ≥9]; (E) Statistical analysis of genes encoding TFs identified in the DEGs; (F) Statistical analysis of genes encoding hormones identified in the DEGs. [ABA: abscisic acid; IAA: auxin; BR: brassinosteroids; CK: cytokinin; GA: gibberellin JA: jasmonic acid; SA: Salicylic acid].

