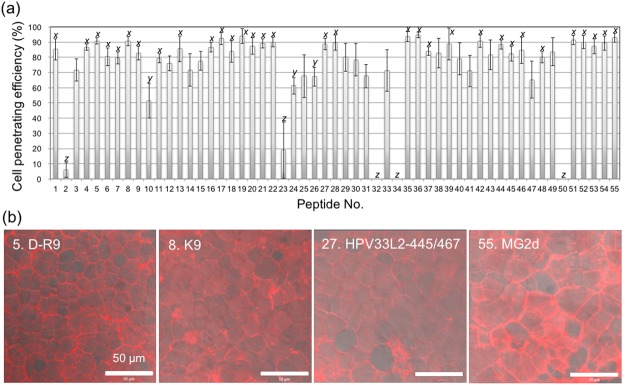
Figure 10.
Cell penetration efficiency into rice (O. sativa) callus by 55 CPPs. (a) The efficiency of penetration determined by counting the penetrated cells at 2 h after infiltration at 30 °C. All data are expressed as the means ± S.D. from triplicate tests; the means labeled with different letters (x, y, and z) are significantly different (Tukey’s HSD test, P < 0.05). (b) CLSM images of the four CPPs of the highest cell penetration efficiency into the rice callus. The CLSM images are overlay of TAMRA fluorescence signal (red) and DIC.

