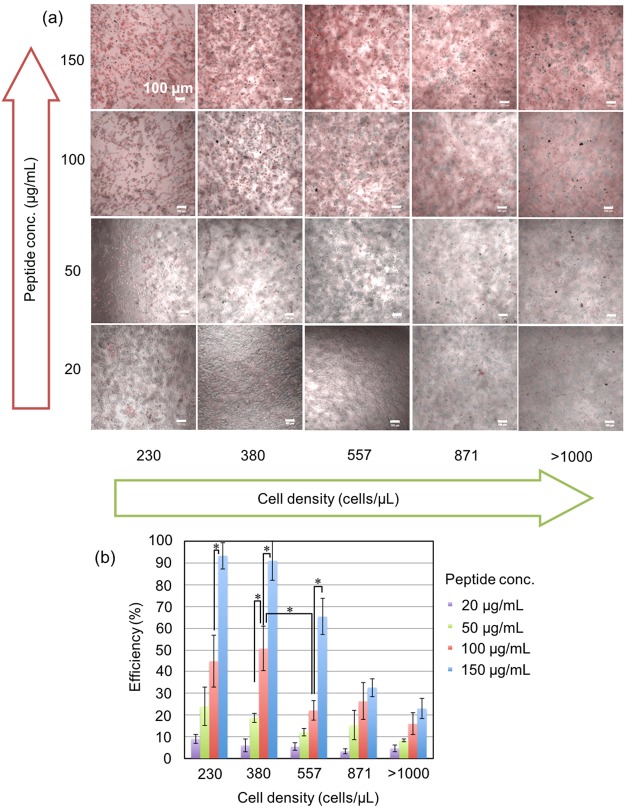
Figure 3.
Effects of peptide concentrations and BY-2 cell densities on cell penetration efficiency. (a) CLSM overlay images of BY-2 cells treated with TAMRA-labeled BP100. Red signals indicate TAMRA fluorescence. The peptide concentration ranged from 20 to 150 µg/mL. The cell density ranged from 230 to > 1000 cells/µL. (b) Cell penetration efficiency of BP100 at different peptide concentrations and BY-2 cell densities. The efficiencies were determined using CLSM images. The error bars show standard deviations of three independent experiments (Tukey’s HSD test, *P < 0.05).

