
Figure 2.
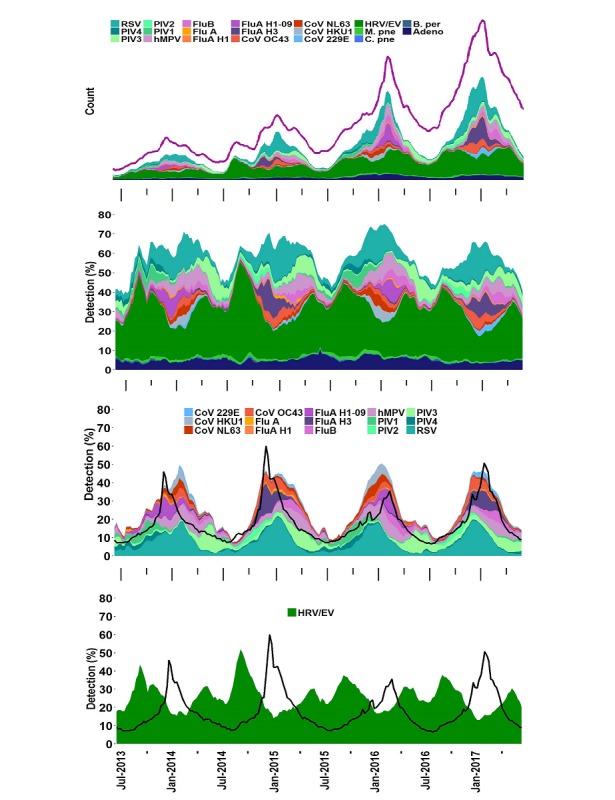
Detection of respiratory panel (RP) organisms over time across all sites. Detection of FilmArray RP pathogens in the Trend dataset displayed as stacked area graphs. All data views have the same time period (July 2013 through July 2017). (First data view) Count of each organism. The test utilization rate (TUR) metric (purple line, units are FilmArray RP tests performed) and count of FilmArray RP tests that are negative (white are between pathogen count and TUR) are indicated. The y-axis values are not indicated as this is considered proprietary information. (Second data view) Pathogen detection rates for all organisms. (Third data view) Pathogen detection rates for the subset of organisms that show seasonality (see Results and the legend for the list of organisms). (Fourth data view) Human rhinovirus (HRV) or enterovirus (EV) detection rates. The CDC weighted influenza-like illness (ILI; scaled up tenfold to be visible against the pathogen data) is indicated (black line) in the third and fourth data views. Organisms follow the same color scheme in all panels; the order of organisms in the legend (down then across) matches that of the stacked area graph top to bottom.