
Figure 4.
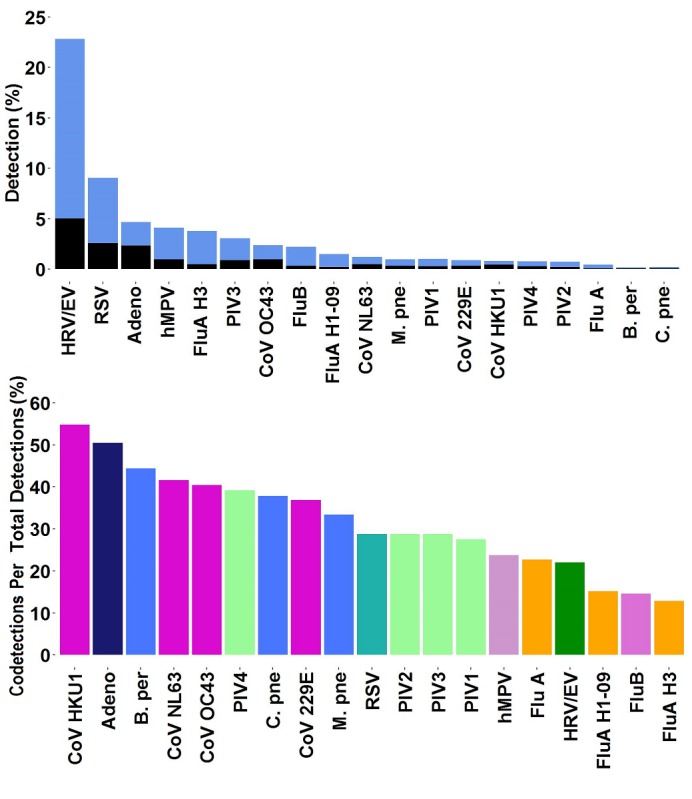
Detection rates for all organisms compared with codetections. Percent total positive detections for each organism in the respiratory panel (RP) Trend dataset is presented in stacked bars, showing the rate of detection of a single organism (first data view, blue) and those involved in a codetection (first data view, black). Data are calculated for each site during the period from July 2013 to July 2017, when available, and then aggregated. (Second data view) Percentage of each organism involved in a codetection is shown. Bars are colored by pathogen family (CoV, purple; bacteria, blue; PIVs, green; Flu A, yellow).