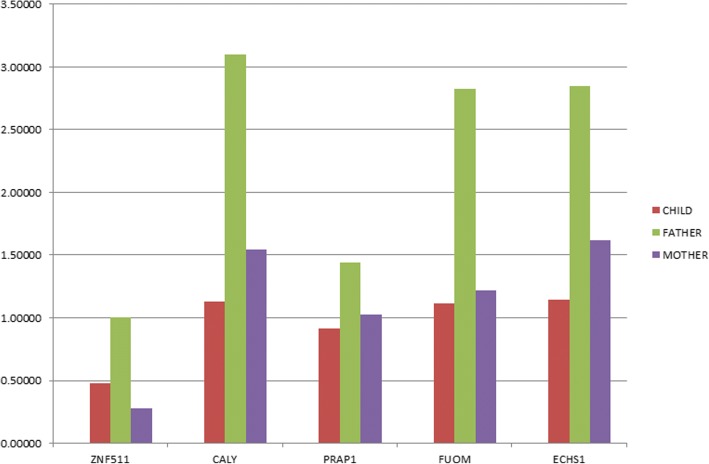
Fig. 4.
RT-PCR shows gene profiles on genomic DNA. To determine relative gene load, a ∆∆Cq method was performed from qPCR data with GAPDH as an endogenous reference gene. These data show a depletion of the ZNF511, CALY, PRAP1, FUOM, and ECHS1 genes in two cases (red and purple histograms) with respect to the father (green histogram), who does not present a deletion of the region of interest

