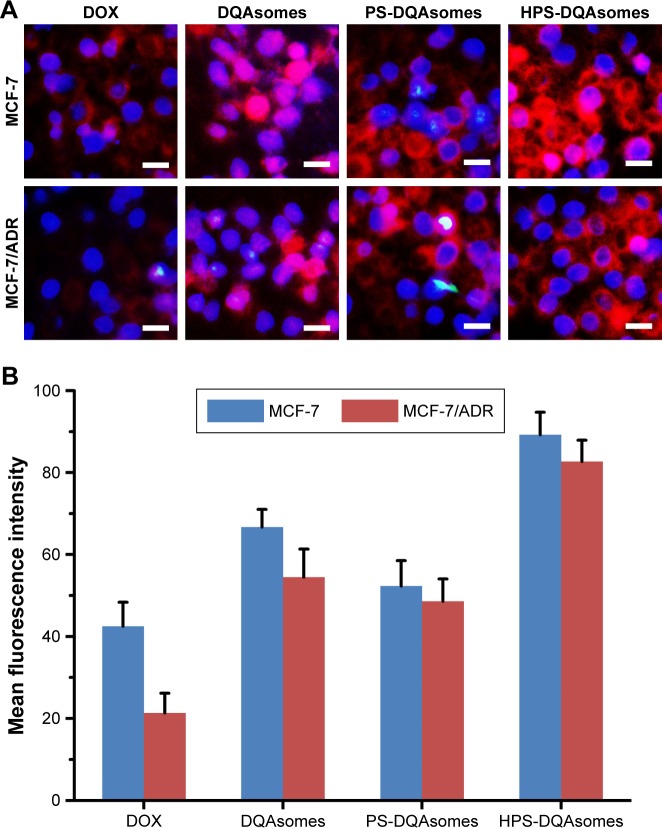
Figure 3.
(A) Fluorescence microscopy images of MCF-7 cells and MCF-7/ADR cells incubated with different formulations. Blue and red pixel dots indicate Hoechst 33258 and DOX, respectively. Scale bar represents 50 μm. (B) Flow cytometry measurement of cellular uptake of different formulations.
Abbreviations: DOX, doxorubicin; DQA, dequalinium.

