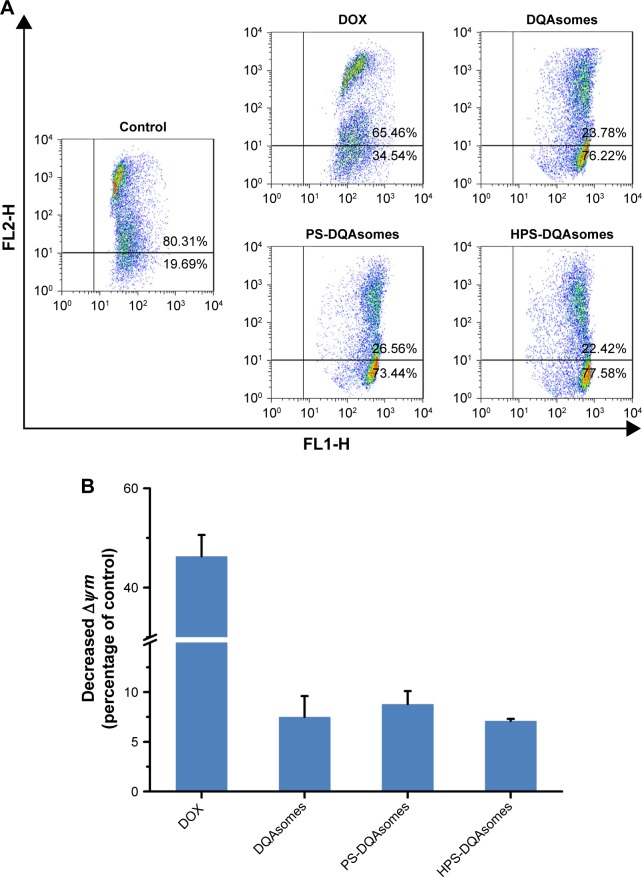
Figure 6.
(A) Mitochondrial membrane potential detection of different formulations against MCF-7/ADR cell line using JC-1 fluorescence dye. (B) Decreased mitochondrial membrane potential (∆Ψm) of different formulations compared with control group. Data were presented as mean ± SD (n=3).
Abbreviations: DOX, doxorubicin; DQA, dequalinium; HPS, HER-2 peptide-PEG2000-Schiff base.

