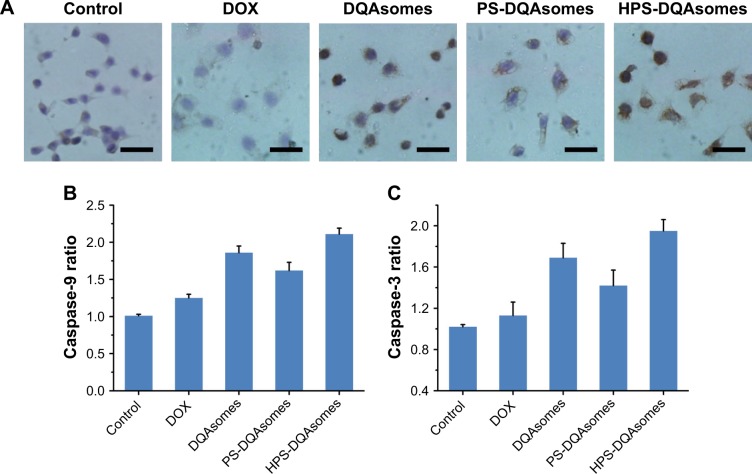
Figure 7.
(A) Immunocytochemical staining images of cytochrome C translocated from mitochondria to cytosol. Brown and blue pixel dots represent cytochrome C and nuclei, respectively. Scale bars represent 100 μm. (B) Caspase-9 and (C) caspase-3 activities’ measurement of different formulations. Data were presented as mean ± SD (n=3).
Abbreviations: DOX, doxorubicin; DQA, dequalinium; HPS, HER-2 peptide-PEG2000-Schiff base.

