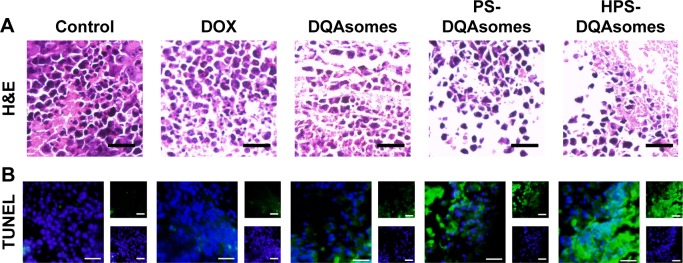
Figure 9.
Ex vivo histological evaluation of tumor tissue.
Notes: (A) H&E staining assay of different formulations treated groups. Blue and pink pixel dots represent nuclei and cytoplasm, respectively. (B) TUNEL assay of different formulations treated groups. Blue fluorescence and green fluorescence indicate nucleic and apoptosis cells, respectively. Scale bar represents 50 μm.
Abbreviations: DOX, doxorubicin; DQA, dequalinium; HPS, HER-2 peptide-PEG2000-Schiff base.

