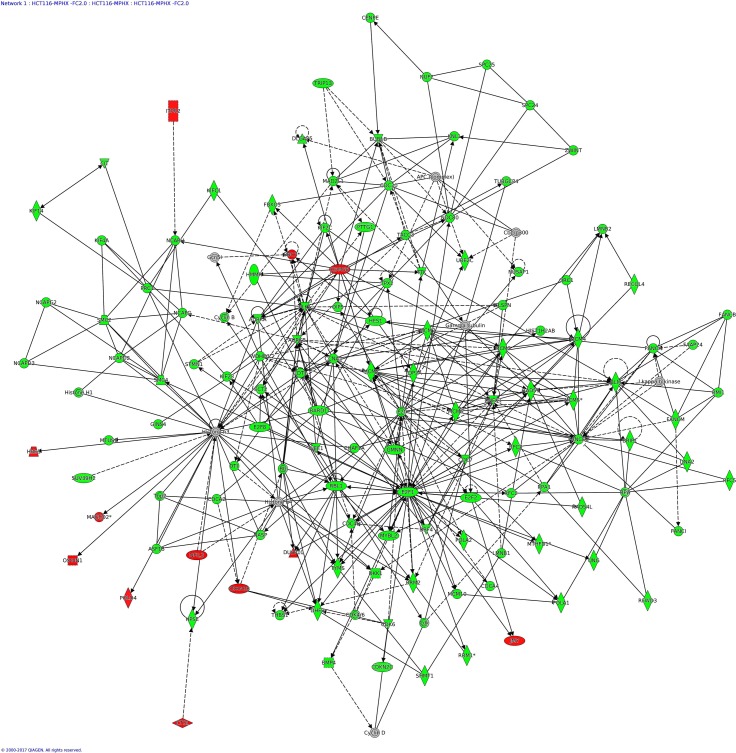
Figure 6. IPA network analysis: annotated interactions between genes in HCT116 cells treated with MP-HX.
The figure shows network 1 in HCT116, containing 124 focus molecules. Most of the focus molecules in this network were downregulated by MP-HX. Top diseases and functions associated with this network include processes related to cell proliferation, cell cycle and DNA replication. Molecules in the network are colored red (MA_FC ≥ + 2.0), green (MA_FC ≥ − 2.0), or grey (MA_FC < ± 2). Data were analyzed through the use of IPA (QIAGEN Inc., https://www.qiagenbioinformatics.com/products/ingenuity-pathway-analysis).

