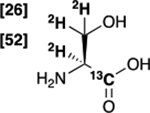
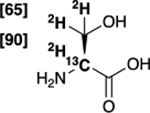
Table 1:
Structures of 13C-enriched molecules after deuterium enrichment. The bracketed number indicates the isotopic enrichment determined by 1H,13C NMR and HRMS (analyses described in the ESI†). ee: enantiomeric excess.
| Molecule | Structure | Chemical yield | ee |
|---|---|---|---|
|
13C on position C1 and 2H on position C2 | |||
| [1-13C,2-2H]alanine 1 |  |
99 % | 99 % |
| [1-13C,2,3-2H3]serine 2 |  |
78 % | 98 % |
| [1-13C,2-2H]lactate 3 |  |
98 % | 86 % |
| [1-13C,2-2H2]glycine 4 |  |
79 % | - |
| [1-13C,2-2H]valine 5 |  |
53 % | 99 % |
|
13C on position C2 and 2H on position C2 | |||
| [2-13C,2-2H]alanine 6 |  |
89 % | 99 % |
| [2-13C,2,3-2H3]serine 7 |  |
77 % | 98 % |
| [2-13C,2-2H]lactate 8 |  |
99 % | 94 % |
