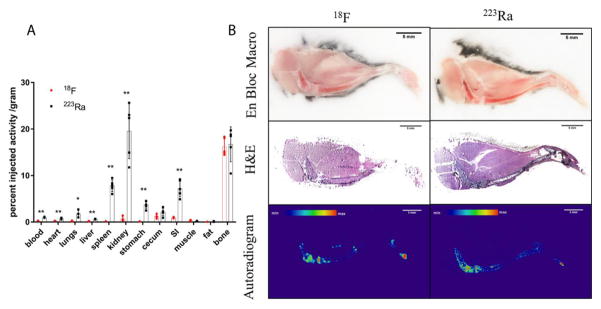
Figure 6.
Biodistribution comparison of [18F]NaF and [223Ra]RaCl2 in healthy C57Bl/6 mice. (A) Replicates (n=5) of gamma counted organs at 1 h after intravenous administration by the retro-orbital sinus to 15 week old male mice. Data are plotted as counts normalized to the injection activity (3.7kBq (100 nCi) for [223Ra]RaCl2 and 370 kBq (10 μCi) for [18F]NaF) and mass of tissue or blood excised ± standard deviation. Statistical student’s t-test was performed between two agents on each organ. * denotes significant difference (p<0.05). ** denotes highly significant difference. Bone = tibia and fibula. (B) Undecalcified whole-mount cryosection and autoradiography of different agent dosed mouse legs: en block color macrophotographs of embedded samples at the cutting surface; H&E staining images of the 10 μm thick sections; autoradiographs acquired on the 10 μm thick sections. Scale bars=5mm.

