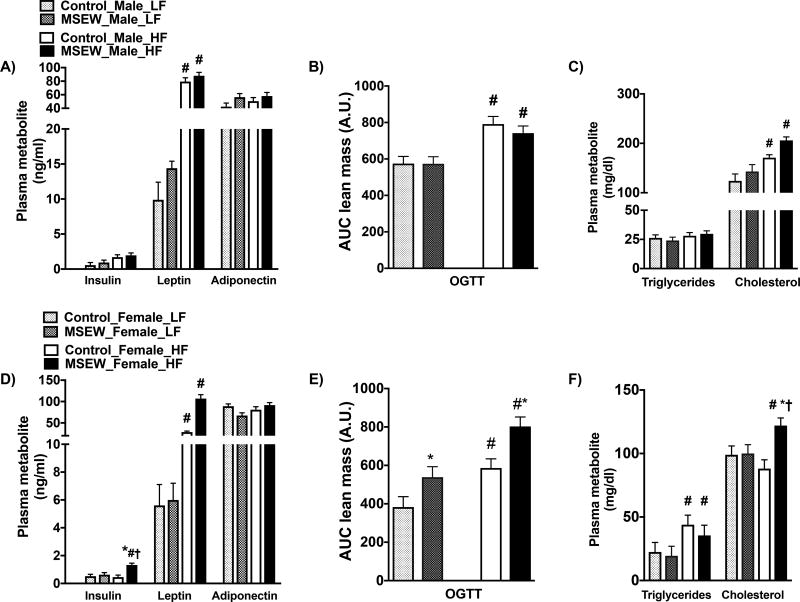
Figure 4.
Effect of MSEW on the plasma metabolic profile after 16 weeks on HF initiated at weaning in males and female mice. Insulin, leptin and adiponectin in A) male and D) female mice. Oral glucose tolerance test (OGTT) in B) male and E) female mice. Plasma triglycerides and cholesterol in C) male and F) female mice. N=6–12 per group.
* P separation, # P diet, †P interaction.
Test between subjects insulin
Male mice: Diet= Prob>F (NS); Separation= Prob>F (NS); Diet*Separation= Pro>F (NS). Female mice: Diet= F ratio (5.2), Prob>F (<0.03); Separation= F ratio (13.5), Prob>F (<0.01); Diet*Separation= F ratio (0.03), Pro>F (0.85).
Test between subjects OGTT
Male mice: Diet= F ratio (23), Prob>F (<0.0001); Separation= F ratio (0.40), Prob>F (0.53); Diet*Separation= F ratio (0.37), Pro>F (0.55). Female mice: Diet= F ratio (20), Prob>F (<0.0001); Separation= F ratio (12.8), Prob>F (<0.001); Diet*Separation= F ratio (0.33), Pro>F (0.56).
Test between subjects Cholesterol
Male mice: Diet= F ratio (17), Prob>F (0.0003); Separation= F ratio (4.2), Prob>F (0.051); Diet*Separation= F ratio (0.38), Pro>F (0.54). Female mice: Diet= F ratio (0.64), Prob>F (0.43); Separation= F ratio (6.6), Prob>F (<0.02); Diet*Separation= F ratio (5.5), Pro>F (0.03).

