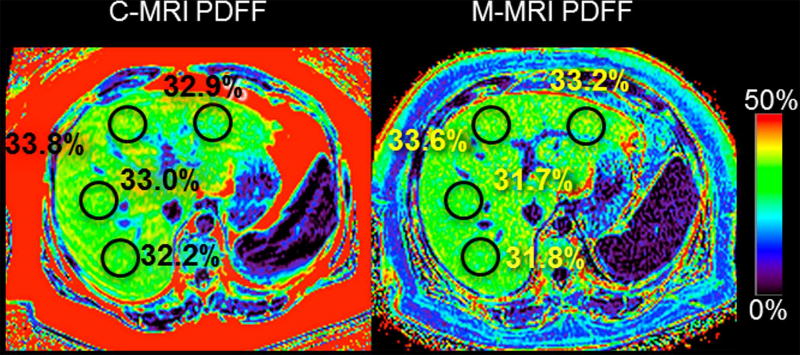
Figure 2. MRI-PDFF assessment and quantification of hepatic steatosis.
Example PDFF maps using complex MRI (C-MRI, left) and magnitude MRI (M-MRI, right) both show elevated PDFF in the liver (~32%). M-MRI is limited to a dynamic range of 0–50% unlike C-MRI which has a full dynamic range from 0–100%.

