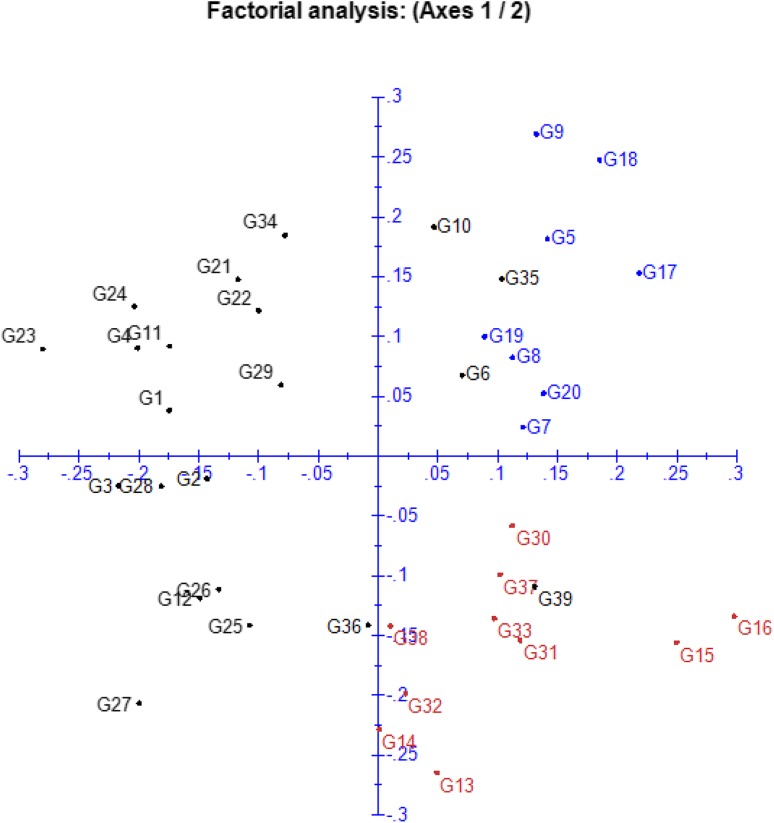
Fig. 4.
Principle coordinate analysis based on molecular data depicting genetic divergence of 39 inbred lines. Genotypes’ numbers are according to Table 1. The proportion of total variation by axis 1: 10.84, axis 2: 9.99, axis 3: 8.56 and axis 4: 7.65

