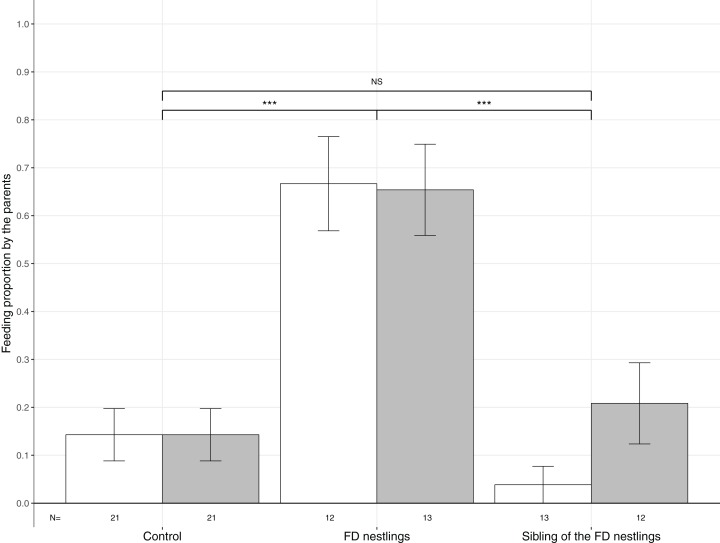
Figure 3. Mean (±SE) proportion of parental feeds according to context and body mass rank.
Parental food transfers could be directed towards the two heaviest (white histograms), the two lightest (grey histograms) or non-focal nestlings. The contexts are Control (no nestlings are food deprived), FD nestlings (after 90 min of food deprivation) and siblings of the 90 min FD nestlings. Post hoc comparisons across contexts (heaviest and lightest nestlings combined) are represented with asterisks (***P < 0.001). N represents the number of experimental nests.

