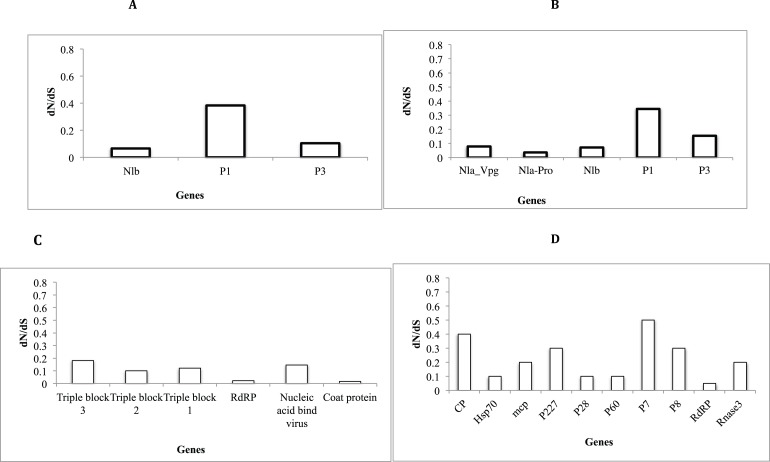
Figure 6. Selection pressure within sites of the coding region of viral gene fragments determined by assessing the average synonymous and non-synonymous (dN/dS) using SLAC that were plotted against each gene segment.
(A) Sweet potato virus C (B) Sweet potato feathery mottle virus (SPFMV) (C) Sweet potato chlorotic fleck virus (SPCFV) (D) RNA1 and RNA 2 genes of Sweet potato chlorotic stunt virus (SPCSV). Genes with selection pressure of below 0.0 were not plotted.

