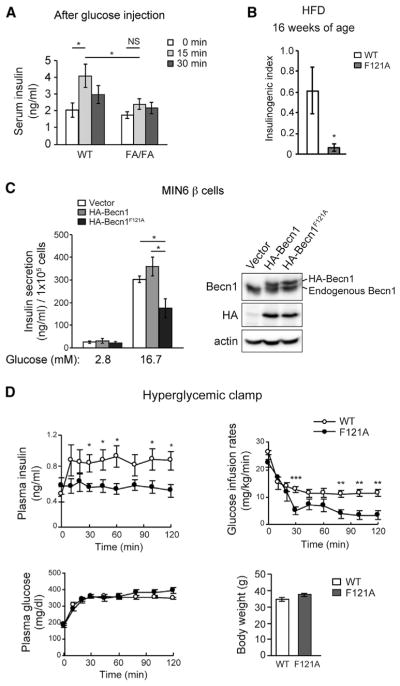
Figure 4. The Autophagy-Hyperactive Becn1F121A Mutation Reduces GSIS.
(A) ELISA analyses of plasma insulin levels 0–30 min after glucose injection in HFD-fed WT and Becn1F121A mice. n = 6–7; one-way ANOVA with Tukey-Kramer test.
(B) Insulinogenic index of WT and Becn1F121A mice fed with HFD for 8 weeks. n = 6.
(C) GSIS in MIN6 β cells stably expressing vector, or hemagglutinin (HA)-tagged WT Becn1 or Becn1F121A mediated by lentivirus, normalized to cell number. Western blot analysis of Becn1 expression in MIN6 cells was shown on the right. n = 5; t test.
(D) Hyperglycemic clamp study of WT and Becn1F121A mice fed with HFD for 9 weeks. Plasma insulin, glucose infusion rate, plasma glucose, and body weight are shown. n = 9–10; t test.
Data represent mean ± SEM. *p < 0.05; **p < 0.01; ***p < 0.001.
See also Figure S7.

