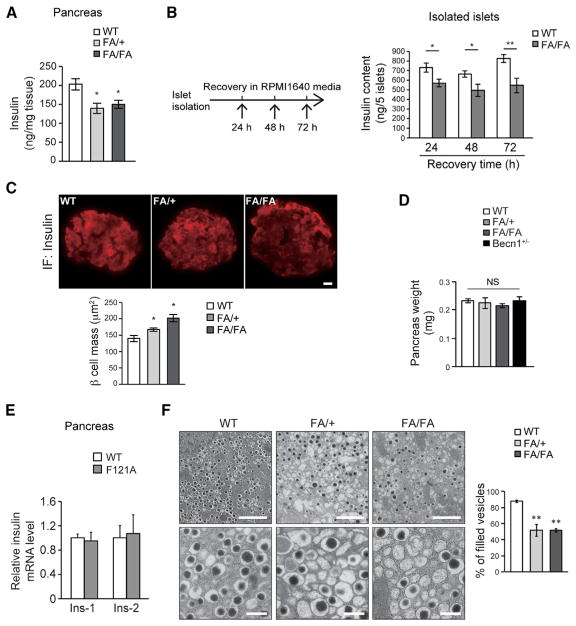
Figure 5. Autophagy-HyperactiveBecn1F121A Mice Have Reduced Pancreatic Insulin Storage in Response to HFD, Despite No Reduction in β Cell or Pancreas Mass.
(A) ELISA analyses of insulin levels in pancreas of HFD-fed WT, FA/+, and FA/FA mice. n = 3–6; one-way ANOVA with Tukey-Kramer test.
(B) ELISA analyses of insulin contents in 5 islets isolated from HFD-fed WT and Becn1F121A mice, in a time course of 24- to 72-hr recovery in RPMI 1640 media after islet isolation. n = 6–10; t test.
(C and D) Immunofluorescence images (top) and quantification (bottom) of β cell mass (insulin-positive area) (C) and quantification of whole pancreas weight (D) in Becn1+/+ (WT), Becn1FA/+ (FA/+), and Becn1FA/FA (FA/FA) mice using anti-insulin antibody. Scale bar, 20 μm. *p < 0.05; NS, not significant; compared with WT. n = 4–6.
(E) Real-time PCR analyses of both insulin genes, Ins-1 and Ins-2, in islets of WT or Becn1F121A mice reveal that insulin mRNA transcription is not affected by autophagy activation. n = 3–6.
(F) EM images (left) and quantification (right) of insulin granules in islets of WT, FA/+, and FA/FA mice fed with an HFD for 8 weeks. Scale bars, 2 μm in the upper panels and 500 nm in the lower panels. Statistics are compared with WT. n = 3 mice. The value of each mouse is an average of 5 islet areas per mouse; one-way ANOVA with Dunnett’s test.
Data represent mean ± SEM. *p < 0.05; **p < 0.01.
See also Figure S7.

