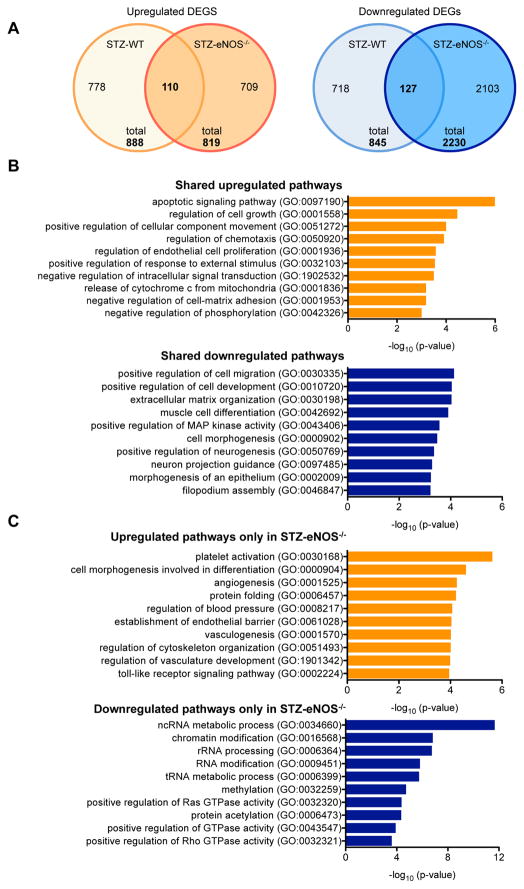
Figure 5. Comparison of DEGs between STZ-eNOS−/− vs. STZ-WT GECs.
(A) Number of upregulated (left) and downregulated (right) DEGs in two diabetic mouse models in comparison to their respective vehicle controls are shown in a Venn diagram. Total number of DEGs is shown on the bottom, and the number of overlapping genes is shown in the overlapping regions. (B) Gene set enrichment analysis of overlapping genes between DEGs[STZ-eNOS−/− vs. Vehicle-eNOS−/−] versus DEGs[STZ-WT vs. Vehicle-WT]. (C) Gene set enrichment analysis of DEGs[STZ-eNOS−/− vs. Vehicle-eNOS−/−] that do not overlap with DEGs[STZ-WT vs. Vehicle-WT]. Significance is expressed as a p-value calculated using Fisher’s exact test (p<0.05) and shown as -log10 (p-value).

