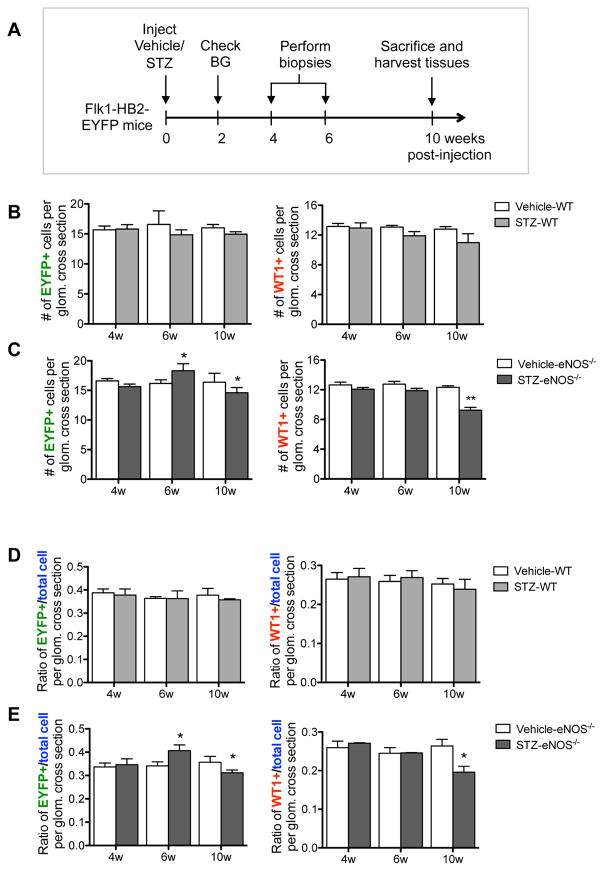
Figure 8. Quantification of GEC and podocyte numbers over time during the early diabetic injury.
(A) Experimental design for time course study. Serial biopsies were performed at 4 and 6 week post STZ-injection and compared with 10 weeks post STZ-injection in both WT and eNOS−/− mice. (B, C) Quantification of EYFP+ cells (left) vs. WT-1+ cells (right) per glomerular cross section in STZ-WT vs. vehicle-WT mice (B) and in STZ- eNOS−/− vs. vehicle-eNOS−/− mice (C). (D, E) Ratio of EYFP+ cells (left) and WT-1+ cells (right) per total DAPI+ cells per glomerular cross section in STZ-WT vs. vehicle-WT mice (D) and in STZ- eNOS−/− vs. vehicle-eNOS−/− mice (E). Results are mean ±SEM of at least 40 glomeruli evaluated per group (n=7 mice per group). *P<0.05 and **P<0.01 when compared to the respective vehicle control at each time point.

