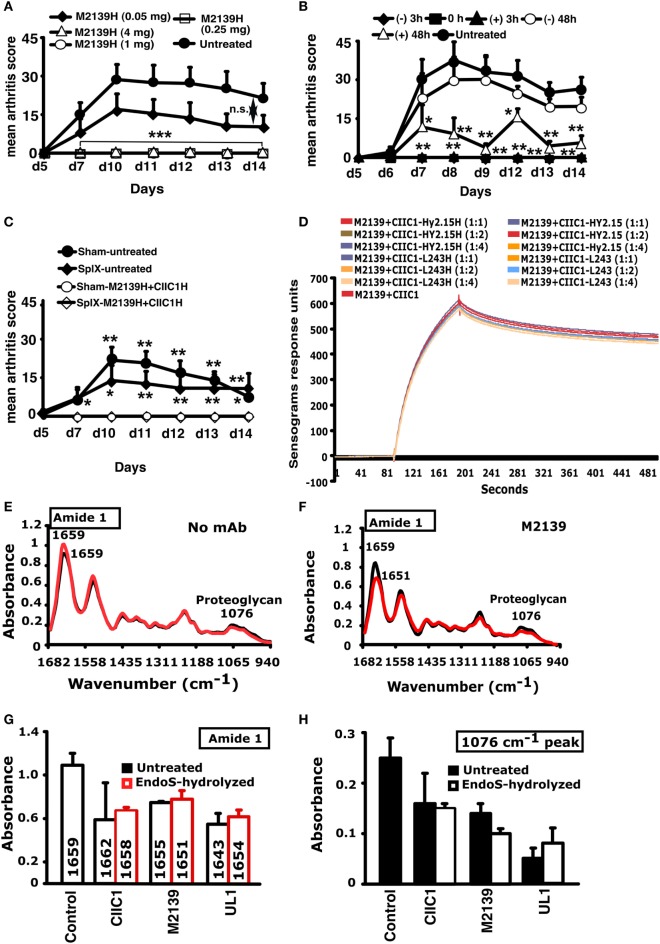
Figure 6.
Inhibition of inflammation and Surface Plasmon Resonance (SPR) and Fourier transform infrared microspectroscopy (FTIRM) analysis. (A) Mice (n = 25) were injected with different concentrations (50–4,000 µg) of endo-β-N-acetylglucosaminidase (EndoS)-hydrolyzed single anti-CII IgG (M2139H), followed by anti-CII mAb. Three hours after the antibody transfer, LPS was injected. H denotes EndoS-hydrolyzed IgG. Hy2.15 and L243 represent mAbs binding to TNP hapten and human HLA-DR antigen, respectively. (B) Mice (n = 30) were injected with 1 mg of EndoS-hydrolyzed anti-CII IgG (M2139H + CIIC1H + CIIC2H + UL1H) at different time points (−48, −3, 0, +3, or +48 h). At 0 and 3 h, anti-CII mAb (M2139 + CIIC1 + CIIC2 + UL1) and then LPS were injected. One group of mice received no treatment. (C) Effect of splenectomy. Mice (n = 21) were either splenectomized (Splx) or sham-operated (Sham). Three weeks later, they were injected with 4 mg of EndoS-hydrolyzed IgG (M2139H + CIICH) or left untreated, followed by anti-CII mAb (M2139 + CIIC1). Panel (H) denotes EndoS-hydrolyzed IgG. Error bars indicate ± SEM. (D) SPR (Biacore) analysis of antibody binding capacity of EndoS-hydrolyzed and unhydrolyzed IgG was performed using CII immobilized on CM5 sensor chip. MAbs were injected at different concentrations through flow cells at a flow rate of 30 µl/min. Antibodies were injected for 3 min and dissociation of bound molecules was observed for 7 min. There was no difference in antibody binding when EndoS-hydrolyzed or unhydrolyzed IgGs were added at different ratios to anti-CII mAb mixture. (E,F) Changes in the chemical composition of the cartilage were assessed using FTIRM analysis. Representative mean spectra are shown from cartilage cultures without antibody (E), and from cartilage cultured for 14 days with 100 µg/ml of unhydrolyzed mAb M2139 (F). The results shown are the mean of 10 measurements taken from the central areas (red line) and near the surface of the tissue (black line). The mean spectra for surface and interior were calculated to assess the effects of antibody penetration on the peaks characteristic of CII and of proteoglycans. (G,H) The mean peaks from the surface cartilage were compared with those from antibody-exposed surface of cartilage exposed to the EndoS-hydrolyzed or unhydrolyzed IgG. Cartilage exposed to either EndoS-hydrolyzed or unhydrolyzed IgG (CIIC1, M2139, and UL1) showed similar changes. (G) The height and location of the amide 1 peak, which represents the total protein content of the tissue, in the region 1,600–1,700/cm. (H) The height of the peak at 1,076/cm represents proteoglycans. All the groups were compared with the untreated group for statistical analysis. *p < 0.05; **p < 0.01; ***p < 0.001; n.s., not significant.

