
. 2018 Jul 21;24(27):3013–3020. doi: 10.3748/wjg.v24.i27.3013
©The Author(s) 2018. Published by Baishideng Publishing Group Inc. All rights reserved.
This article is an open-access article which was selected by an in-house editor and fully peer-reviewed by external reviewers. It is distributed in accordance with the Creative Commons Attribution Non Commercial (CC BY-NC 4.0) license, which permits others to distribute, remix, adapt, build upon this work non-commercially, and license their derivative works on different terms, provided the original work is properly cited and the use is non-commercial.
Figure 2.
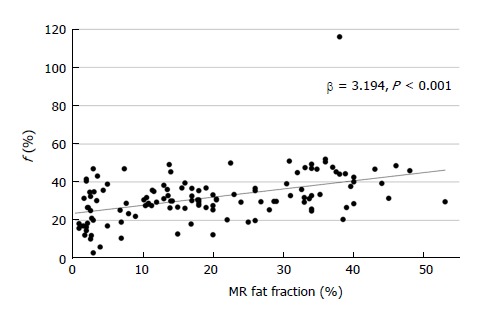
Scatter plot of MR fat fraction and f value, showing a positive correlation.