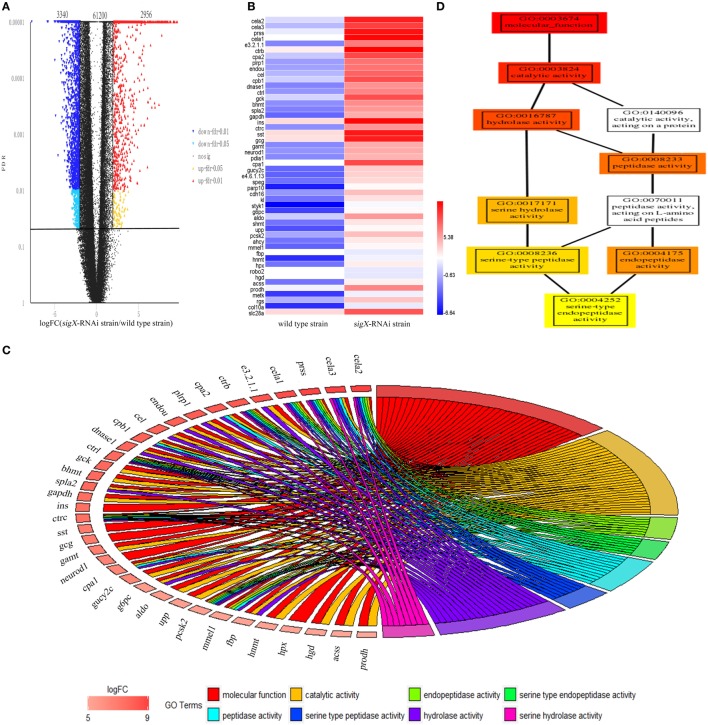
Figure 3.
Differentially expressed genes (DEGs) of Epinephelus pinephelus infected by Pseudomonas plecoglossicida and gene ontology (GO) analysis. (A) Volcano plot of all genes, X-axis represent the fold change values of samples infected by sigX-RNAi strain/samples infected by wild-type strain, Y-axis represent statistical test value [false discovery rate (FDR)], the higher represent the more significant differences. Each dot represents a particular gene: the red dots indicate significantly up-regulated genes; the blue dots represent significant down-regulated genes; and the black dots represent non-significant differences genes. (B) Heat map of the top 50 up-regulated genes (adjusted FDR < 0.05; ǀ log2FC ǀ ≥ 1; 3 biological replicates) between wild-type strain and sigX-RNAi strain infections. Values represent log2 folds. Colors based on log-transformed transcripts FPKM mean values. Blue and red indicate decreased and increased expression, respectively. (C) Chordal graph of top 50 DEGs to GO terms. (D) GO-directed acyclic graph chart of 8 GO terms which belongs to molecular function. Each node at the right half of the circle represents one of the 8 GO term, each node at the left half of the circle represents a gene. The degree of colors represents the enrichment significance levels according to P-value. The redder the color of the gene, the greater the up-regulation of the expression.

