Figure 1.
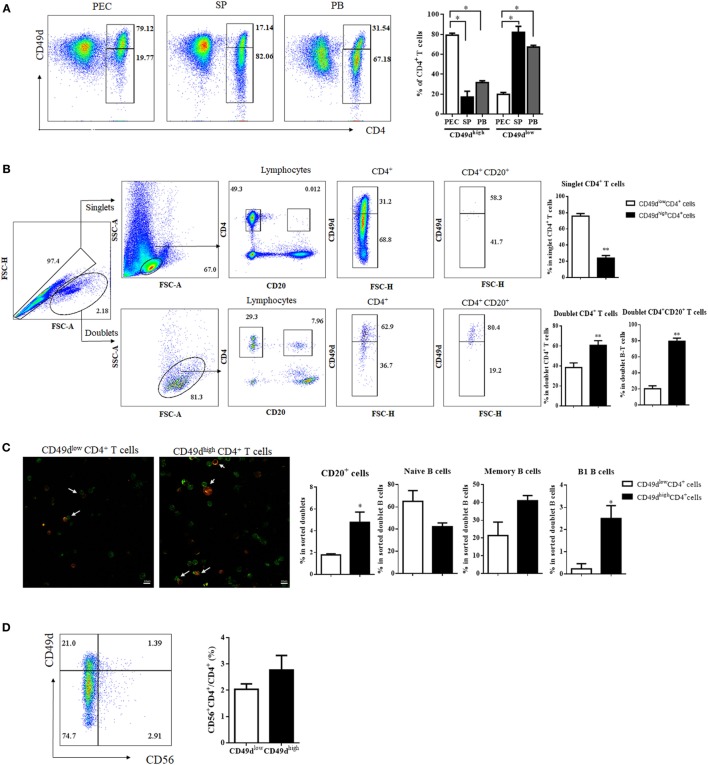
CD49dhigh CD4+ T cells were more prevalent in the human PEC than in the SP or PB. (A) Flow cytometric plots showing expression of CD4 and CD49d (integrin α4) in cells from the PEC, SP, and PB. Values in diagrams indicate proportions of the gated population (left panel). Proportions of CD49dhigh CD4+ and CD49dlow CD4+ T cells among CD4+ T cells in the PEC (white), SP (black), and blood (gray) (right panel). (B) For analysis of doublet CD4+ T cells, singlets and doublets were gated based on FSC-A and FSC-H. After gating for CD4+CD20− or CD4+CD20+, each population was examined for CD49d expression. Values in diagrams indicate proportions of the gated population. Proportions of CD49dhigh CD4+ (black) and CD49dlow CD4+ T cells (white) in the singlet CD4+, doublet CD4+, and doublet CD4+CD20+ cells (right panel). (C) Immunofluorescence images of PB B–T conjugates (green: CD4, red: CD20, magnification 200×). White arrows indicate conjugate of B and T cells (left panel). Proportions of total CD20+ B cells, CD20+ CD27− CD43− naïve B cells, CD20+ CD27+ CD43− memory B cells, and CD20+ CD27+ CD43+ B-1 cells in CD49dhigh CD4+ (black) and CD49dlow CD4+ T cell populations (white) (right panel). (D) To check for the presence of NKT cells in CD49dhigh CD4+ and CD49dlow CD4+ T cells, CD4+ T cells were examined for the expression of CD56 as well as CD49d. Proportions of CD56+ NKT cells among CD49dhigh CD4+ (white) and CD49dlow CD4+ T cells (black). The data are expressed as the mean ± SEM (n = 4–10 donors per each group). *P < 0.05, **P < 0.01; Student’s t-test. Abbreviations: PEC, peritoneal cavity; SP, spleen; PB, peripheral blood.

