FIGURE 4.

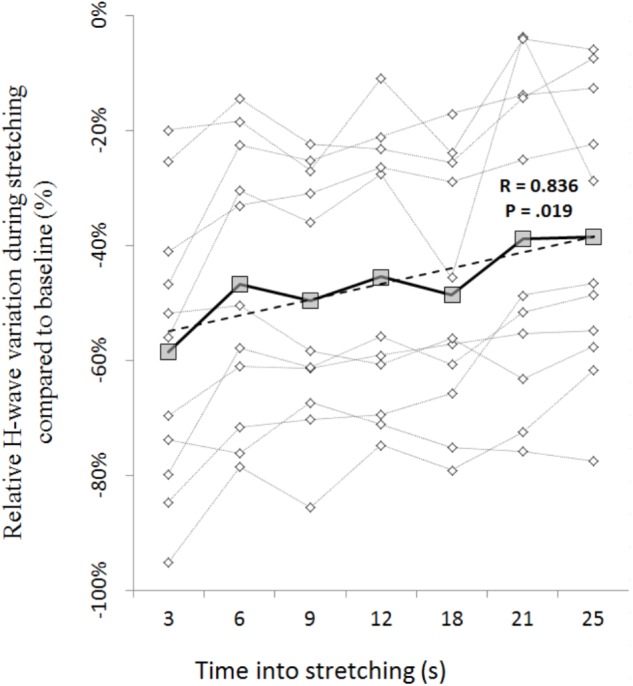
Time course of H-reflex inhibition during stretching for each participant (dotted lines with diamonds) and group average (solid line with squares). Group trend line is shown by the dashed line.

Time course of H-reflex inhibition during stretching for each participant (dotted lines with diamonds) and group average (solid line with squares). Group trend line is shown by the dashed line.