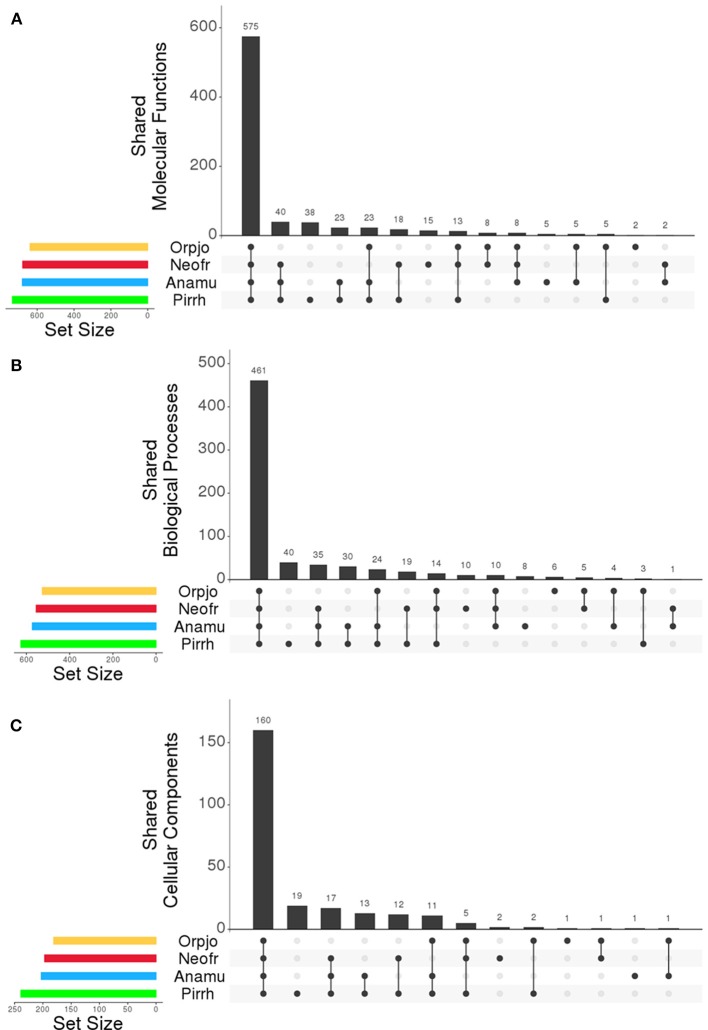
Figure 1.
Comparison of the (A) molecular functions, (B) biological process, and (C) cellular components assigned to transcripts expressed by O. joyonii (Yellow), N. frontalis (Red), A. mucronatus (Blue), and P. rhizinflata (Green). Set size indicates the total number of GO functions identified in each organism within each category. The bars indicate the number of GO functions that are shared in the organisms being compared as indicated along the X-axis of the plot. Figure was generated with R using UpSet (Lex et al., 2014).

