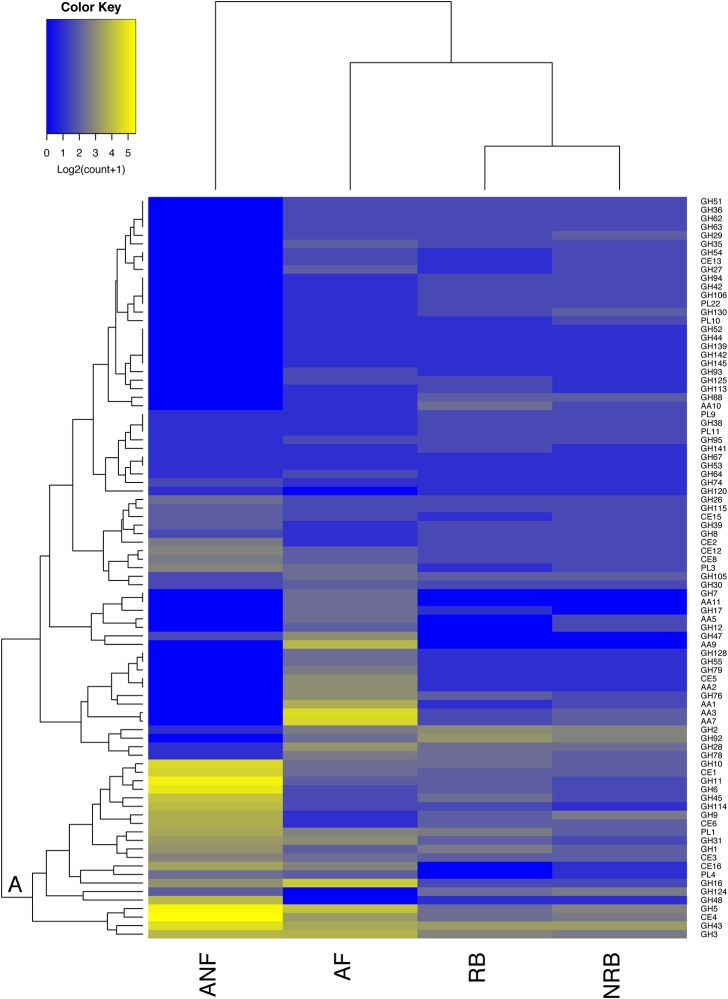
Figure 2.
Comparison of the abundance of 87 CAZyme families expressed by anaerobic fungi (ANF) with their abundance in aerobic fungi (AF), non-rumen bacteria (NRB), and rumen bacteria (RB). The mean abundance of each CAZy family was calculated according to description in the materials and methods and was log2 transformed before generating a heatmap in R. CAZy families with high and low abundance are shown in blue and yellow, respectively. Hierarchical clustering on the vertical axis is based on the mean abundance of each CAZy family included in the analysis. Hierarchical clustering of the horizontal axis is based on the similarity among the distribution of these 87 CAZy modules among organism groups.

