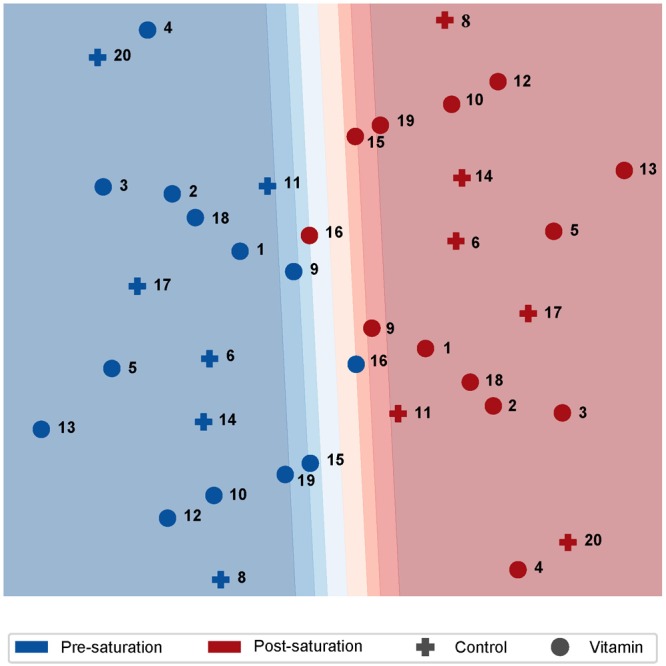
FIGURE 2.

Two-dimensional plot of sample relation after PLS analysis of paired cDNA microarray data from professional saturation divers. Individual diver numbers are shown next to each data point. Separation of samples along the first primary component (PC1) was predominantly explained by the time of sample collection; i.e., pre- or post-saturation diving. The antioxidant vitamin supplements had no effect on either of the two first PLS components. Responses to saturation diving on the level of gene expression.
