Figure 2.

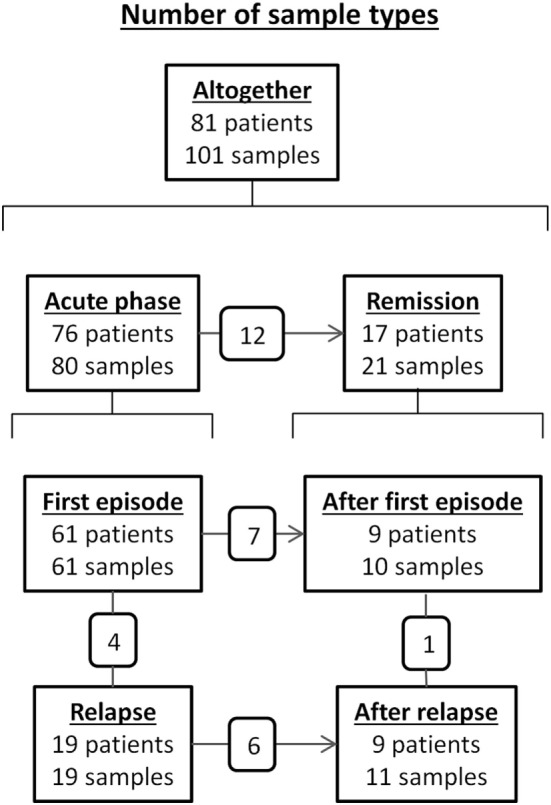
Number of patients and samples tested for anti-ADAMTS13 IgG subclass distribution according to disease stage. The number of common patients between disease stage groups are shown in the small boxes over the connecting lines.

Number of patients and samples tested for anti-ADAMTS13 IgG subclass distribution according to disease stage. The number of common patients between disease stage groups are shown in the small boxes over the connecting lines.