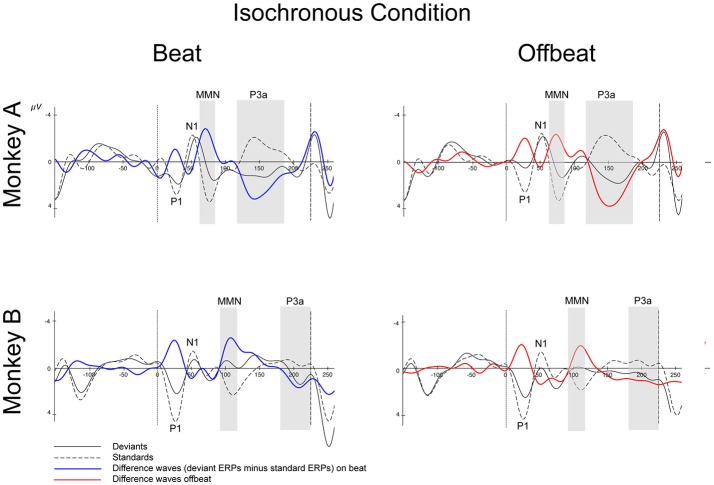
Figure 5.
Event-related potentials at Cz for the isochronous condition. Deviants are marked with solid black lines, standards with dotted black lines. Difference waves (deviant ERPs minus standard ERPs) on the beat are represented with solid blue lines, offbeat with solid red lines, for Monkey A and Monkey B. The gray-shaded areas indicate the time windows used in the statistical analyses of the MMN and P3a. Dotted vertical lines indicate the start of the sound event, dashed vertical lines indicate the onset of the next sound event (at 225 ms). See Table 2 for details on time ranges used.

