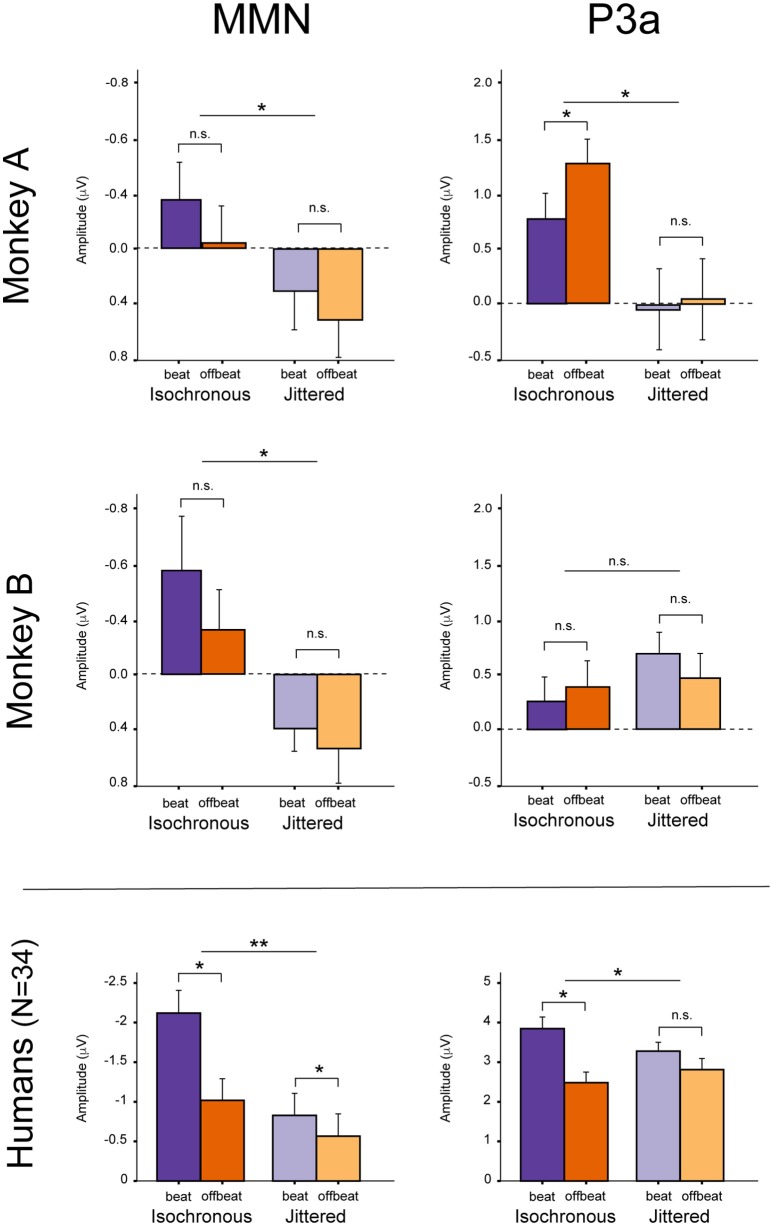
Figure 8.
Summary of the results. MMN and P3a in Monkey A (Top) and Monkey B (Middle). For comparison, the (Bottom) shows the mean results for humans (N = 34), unattended condition (see Table 1 in Bouwer et al., 2016). Note that the y-axes are different for the monkey and human data. Error bars represent one standard error of the mean. *Significant interaction.

