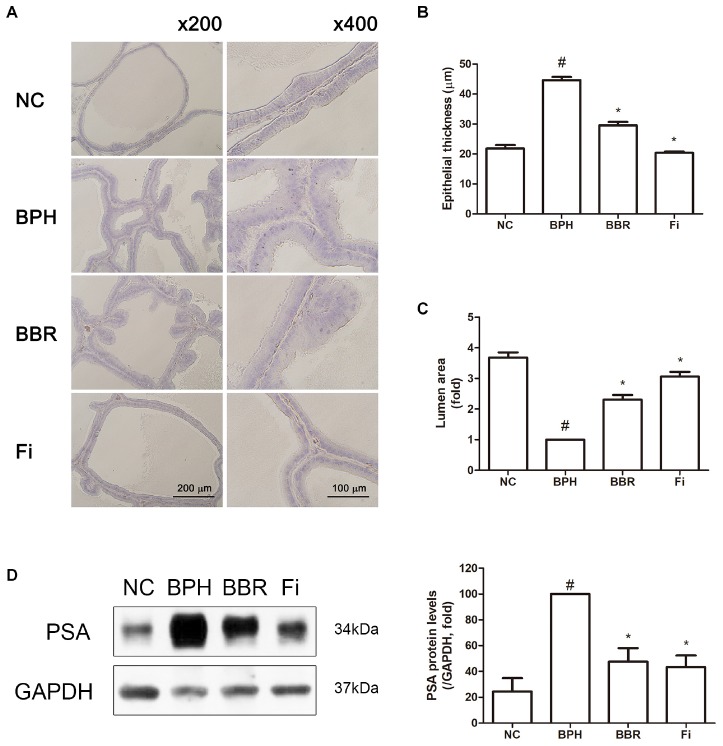
FIGURE 1.
Effect of BBR on histological changes and protein expression of PSA in prostate tissues of TP-induced BPH rats. (A) Representative photomicrographs of H&E stained prostate tissues (left panels, magnification ×200; right panels, magnification ×400) are shown. (B) The epithelial thickness and (C) the relative lumen area of the prostate tissues were measured using ImageJ software. Values are mean ± SD of of ten or more separate measurements. (D) The protein expression of PSA was analyzed by a Western blot analysis. Values are mean ± SD of three or more separate measurements. #P < 0.05 when compared to NC; ∗P < 0.05 when compared to BPH. The protein expression differences are normalized to GAPDH. NC, normal control group; BPH, TP-induced BPH group; BBR, BBR-treated BPH group; Fi, finasteride-treated BPH group.

