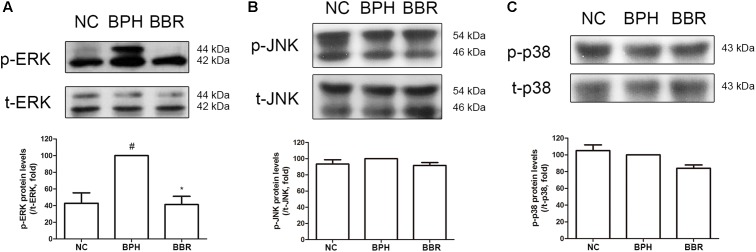
FIGURE 3.
Effect of BBR on MAPK expressions in prostate tissues of TP-induced BPH rats. The phosphorylation levels of (A) ERK, (B) JNK, and (C) p38 were analyzed by a Western blot analysis. Values are mean ± SD of three or more separate measurements. #P < 0.05 when compared to NC; ∗P < 0.05 when compared to BPH. The protein expressions differences of p-ERK, p-JNK, and p-p38 were normalized to total ERK, total JNK, and total p38, respectively. NC, normal control group; BPH, TP-induced BPH group; BBR, BBR-treated BPH group.

