
FIGURE 4.
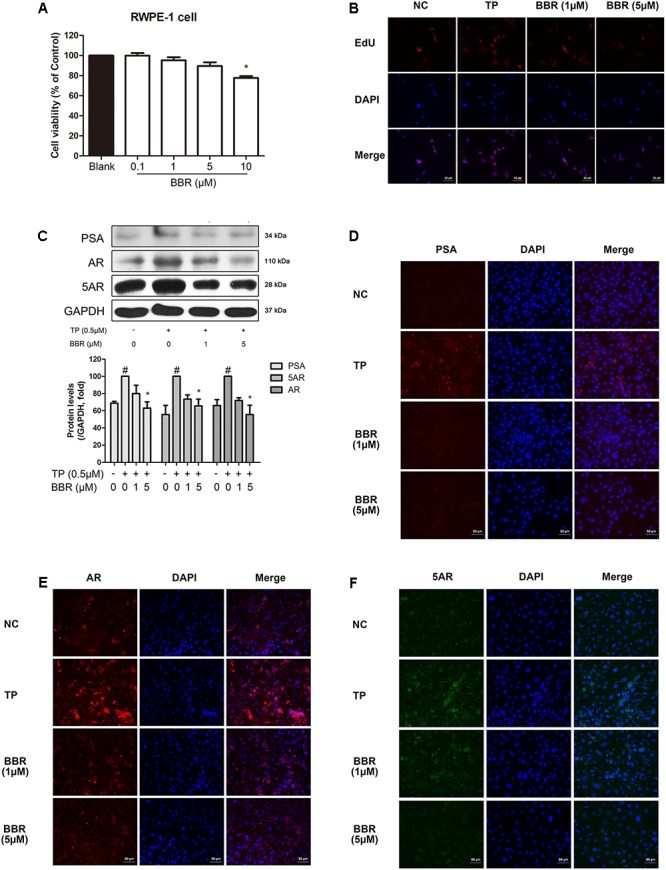
Effect of BBR on BPH-related factors in TP-treated RWPE-1 cells. (A) Cell viability was assessed by an MTS assay. Values are mean ± SD of 10 or more separate experiments ∗P < 0.05 when compared to TP. (B) Representative photomicrographs of EdU assay of TP-treated RWPE-1 cells are shown. (C) The relative protein expressions of PSA, AR, and 5AR were analyzed by a Western blot analysis. Values are mean ± SD of three or more separate measurements. #P < 0.05 when compared to NC; ∗P < 0.05 when compared to BPH. The protein expressions differences were normalized to GAPDH. IF staining of (D) PSA (red), (E) AR (red), and (F) 5AR (green) merged with DAPI (blue) was performed. NC, normal control group; TP, TP-treated group; BBR, BBR-treated group.