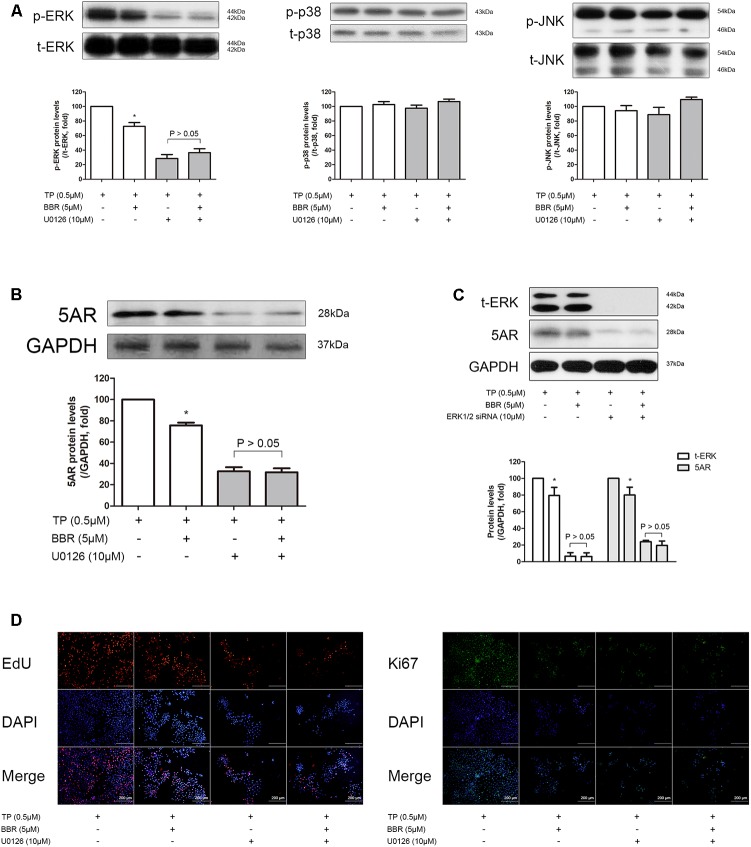
FIGURE 5.
Effect of BBR on BPH-related factors after ERK inhibition in TP-treated RWPE-1 cells. The relative protein expressions of (A) p-ERK, p-JNk, p-p38 and (B) 5AR after U0126 co-treatment were analyzed by a Western blot analysis. (C) Relative protein expressions of t-ERK and 5AR after siERK1/2 co-treatment were analyzed by a Western blot analysis. Values are mean ± SD of three or more separate experiments. ∗P < 0.05 when compared to TP. The protein expressions differences of 5AR were normalized to GAPDH. The protein expressions differences of p-ERK, p-JNK, and p-p38 were normalized to total ERK, total JNK, and total p38, respectively. (D) Representative photomicrographs of EdU assay of ERK-inhibited RWPE-1 cells are shown. IF analysis of Ki67 (green) merged with DAPI (blue) was performed. NC, normal control group; TP, TP-treated group; BBR, BBR-treated group.

