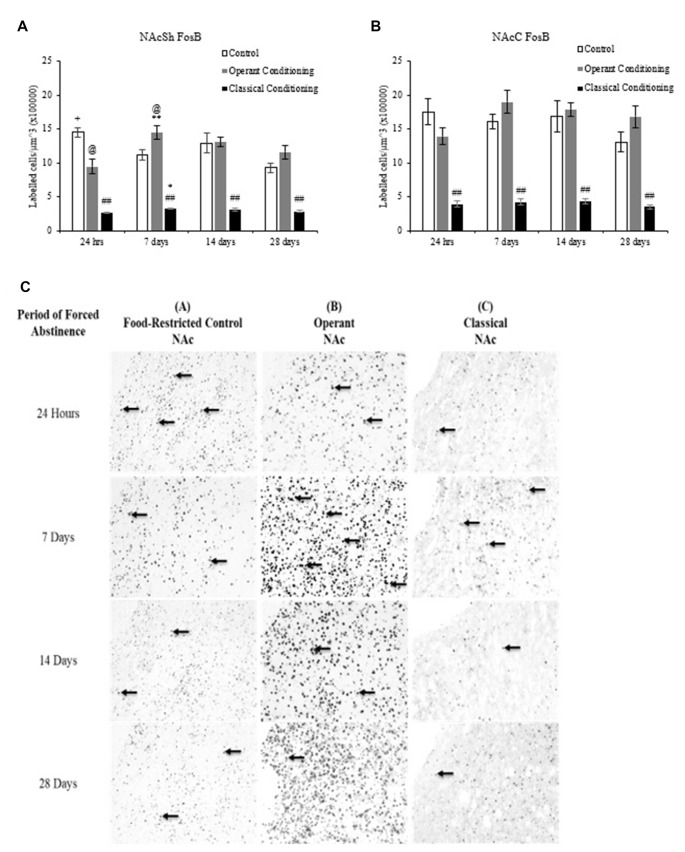
Figure 5.
Average cell density (mean cell count/volume [mm3]) of FosB labeled neurons (mean ± SEM). (A) NAcSh labeled neurons in rats that underwent operant and classical conditioning compared to food-restricted controls. ##p < 0.01 compared to operant conditioning and control at the same abstinence period. @p < 0.05 compared to control at the same abstinence period. *p < 0.05 compared to classical conditioning at 24 h. **p < 0.01 compared to operant conditioning at 24 h. +p < 0.05 compared to control at 28 days. (B) NAcC labeled neurons in rats that underwent operant and classical conditioning compared to food-restricted controls. ##p < 0.01 compared to operant and classical conditioning at the same abstinence period. (C) Representative images of FosB labeling in the NAc in rats that underwent operant and classical conditioning and food restricted controls 20×.

