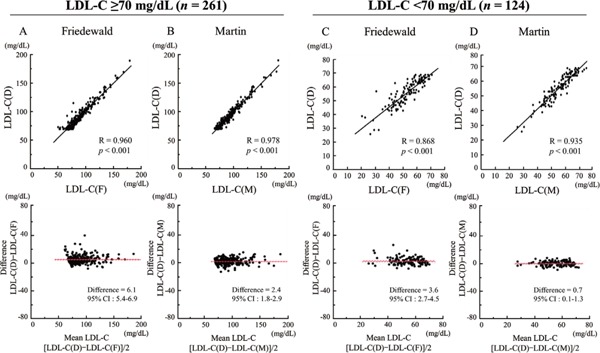
Fig. 3.

Comparison of correlation between LDL-C(D) and LDL-C(F) or LDL-C(M) levels in patients with LDL-C(D) < 70 mg/dL (n = 124) and LDL-C(D) ≥ 70 mg/dL (n = 261).
(A) LDL-C(D) versus LDL-C(F) in patients with LDL-C(D) < 70 mg/dL. (B) LDL-C(D) versus LDL-C(M) in patients with LDL-C(D) < 70 mg/dL. (C) LDL-C(D) versus LDL-C(F) in patients with LDL-C(D) ≥ 70 mg/dL. (D) LDL-C(D) versus LDL-C(M) in patients with LDL-C(D) ≥ 70 mg/dL. Upper panels indicate linear regression analysis, whereas lower panels indicate Bland–Altman plots. CI, confidence interval; LDL-C, low-density lipoprotein cholesterol; LDL-C(D), LDL-C measured by direct assay; LDL-C(F), LDL-C calculated using the Friedewald formula; LDL-C(M), LDL-C calculated using the Martin method.
