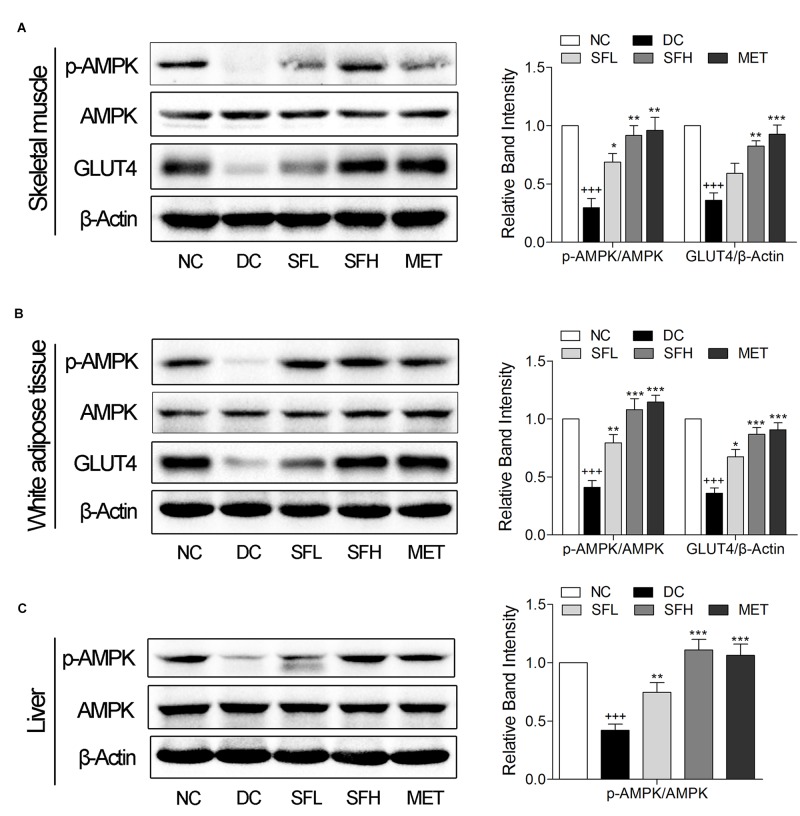
FIGURE 5.
SD-FRE enhanced GLUT4 expression, activated AMPK phosphorylation in insulin target tissues. Western blot analysis of AMPK phosphorylation, GLUT4 expression in skeletal muscle (A) and WAT (B) of KK-Ay mice. (C) Western blot analysis of AMPK phosphorylation in liver of KK-Ay mice. Data are mean ± SEM, shown as relative band intensity compared with NC group (n = 3). +++p < 0.01 vs. NC group, ∗p < 0.05, ∗∗p < 0.01, ∗∗∗p < 0.001 vs. DC group.

