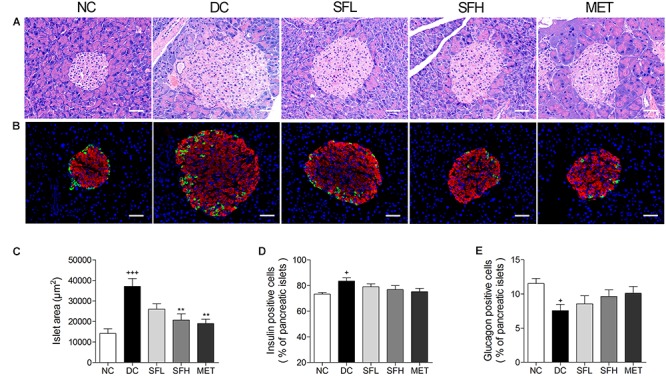
FIGURE 8.

SD-FRE treatment reversed islet hypertrophy in pancreas of KK-Ay mice. (A) Pancreas sections were stained with HE and observed under light microscopy. (B) Pancreas sections were stained with insulin (red), glucagon (green) and DAPI (blue), observed under fluorescence microscopy. Scale bar, 50 μm. Quantified average islet area (C), the percentage of insulin-positive beta cells (D) and glucagon-positive alpha cells (E) in pancreatic islets. Data are mean ± SEM. n = 4 sections per group. +p < 0.05, +++p < 0.001 vs. NC group, ∗∗p < 0.01 vs. DC group.
