FIGURE 3.

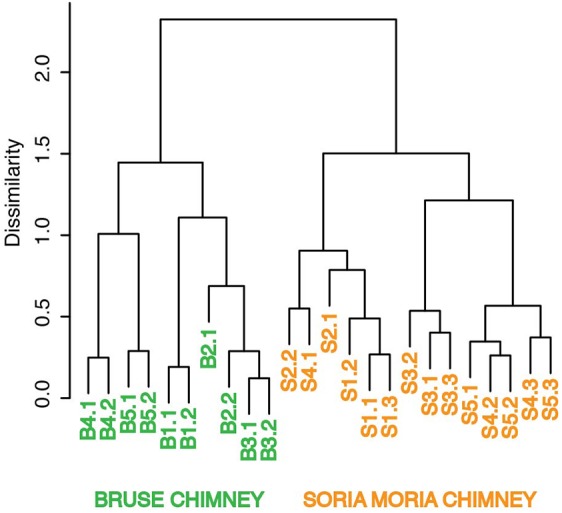
Ward’s minimum variance clustering of samples from Soria Moria- and Bruse chimney walls. Clustering was based on Bray-Curtis distances of relative abundances of OTUs. Sample names correspond to the short names given in Table 1.

Ward’s minimum variance clustering of samples from Soria Moria- and Bruse chimney walls. Clustering was based on Bray-Curtis distances of relative abundances of OTUs. Sample names correspond to the short names given in Table 1.