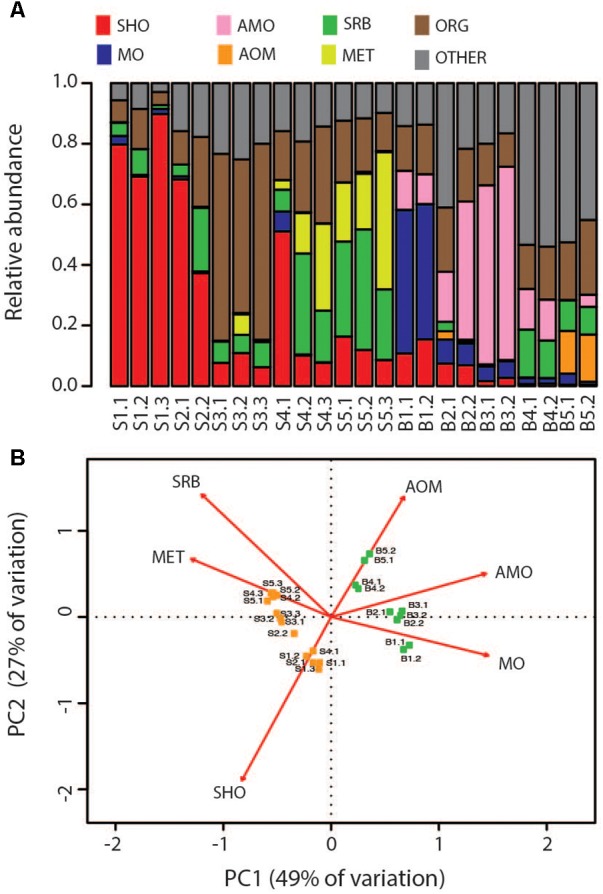
FIGURE 5.

Comparison of the Bruse chimney and Soria Moria chimney in terms of the functional groups of microorganisms they host. Functional assignments were performed based on taxonomic information (see Supplementary Material). Abbreviations of functional groups are the same as in Table 2. (A) Distribution of functional groups in each sample. (B) Ordination diagram in two dimensions from Principal Component Analyses based relative abundances of functional groups after removal of organotrophs and metabolically unassigned organisms. The ordination is drawn as a biplot where samples are represented as dots and functional groups by arrows. Eigenvectors are scaled to unit length and distances among objects and the biplot are approximations of their Euclidian distance in multidimensional space. Arrows point in the direction of maximum variance of relative abundance of respective functional groups. Arrow lengths correspond to the contribution to variation in community composition between samples. Sample names correspond to the short names given in Table 1.
