
Figure 2.
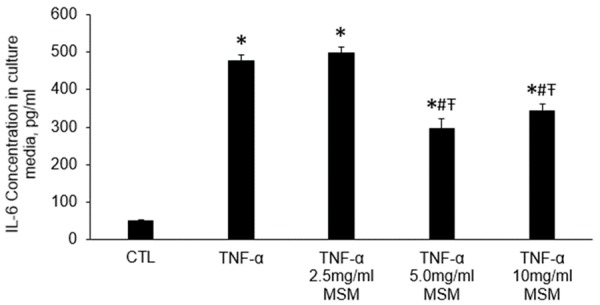
IL-6 concentration in culture media following indicated treatments for 24 hours. CTL, Control, TNF-α, tumor necrosis factor-α, MSM, methylsulfonylmethane. Data represents group means ± SEM. Cell treatment with TNF-α resulted in elevated IL-6 production, which was attenuated by either 5.0 mg/ml or 10 mg/ml MSM. * indicates different from CTL, # indicates different from TNF-α, Ŧ indicates different from TNF-α 2.5 mg/ml MSM P ≤ 0.05.