
Figure 3.
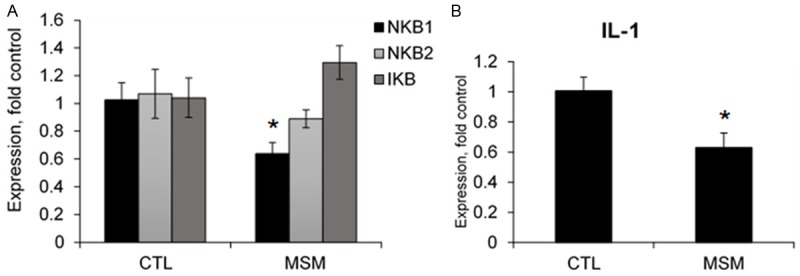
Transcript expression in MSM treated cells compared to control. CTL, control, MSM, methylsulfonylmethane, NFκB, nuclear factor-κB, IκB, inhibitor of κB, IL-1, interleukin-1. Data represents group means ± SEM, n=4. A. MSM treatment resulted in lower expression of NFκβ1. B. MSM treatment resulted in lower expression of IL-1 compared to control (CTL). * indicates significantly different from CTL, P ≤ 0.05.