
Figure 4.
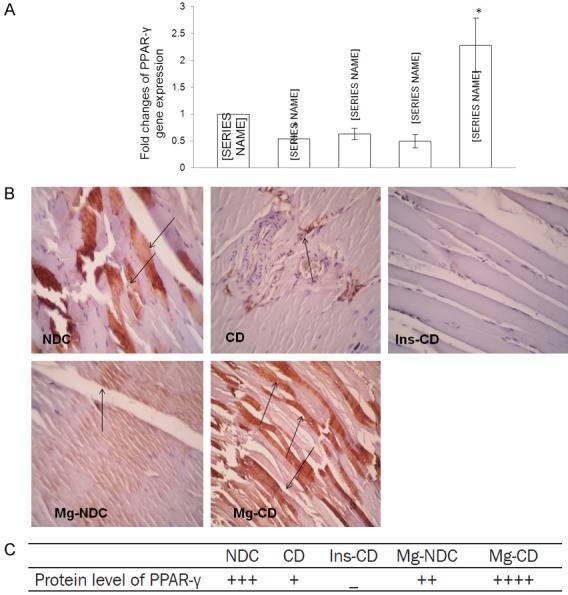
Comparison of the fold changes of PPAR-γ gene expression (A), immunohistochemistry for PPAR-γ (B and C) and protein level of PPAR-γ in non-diabetic control (NDC), chronic diabetic (CD), Mg2+-treated non diabetic control (Mg2+-NDC), insulin-treated chronic diabetic (Ins-CD) and Mg2+-treated chronic diabetic (Mg2+-CD) groups (10 rats in each group). *Significant different between Mg2+-CD and other groups (P<0.0001).